Martin Bricelj Baraga
cyanometer
Monument to the blueness of the sky
Coming Soon
Cyanometer
Look to the sky
The Cyanometer by Martin Bricelj Baraga is a monument to the blueness of the sky. It is inspired by the original cyanometer invented by Horace-Bénédict de Saussure. His cyanometer - a blue color wheel, forms the core of the monument, gently directing our gaze back to the sky.
The Cyanometer is both a monument and software that periodically collects images of the sky. The monolith gathers data about the blueness of the sky and the quality of air and visualises them, thus becoming an instrument that raises awareness of the quality of one of the crucial elements of life. Together with air quality data, the Cyanometer website is creating a special kind of online archive and retrospective calendar that is measuring and documenting the changes to our environment.
In a cloud based world, the only clouds that really matter are the ones we see in the sky.
History
Who was Horace Benedict de Saussure?
Horace Benedict de Saussure was a Geneva-based scientist who was interested in geology, physics and topography of the Alps. Recognized as the founder of alpinism, he was an explorer driven to be the first to climb Mont Blanc.
As a scientist, he explored other atmospheric phenomena by inventing devices to measure humidity, wind, magnetism and the intensity of the sun's rays - leading to the invention of the world's first solar oven.
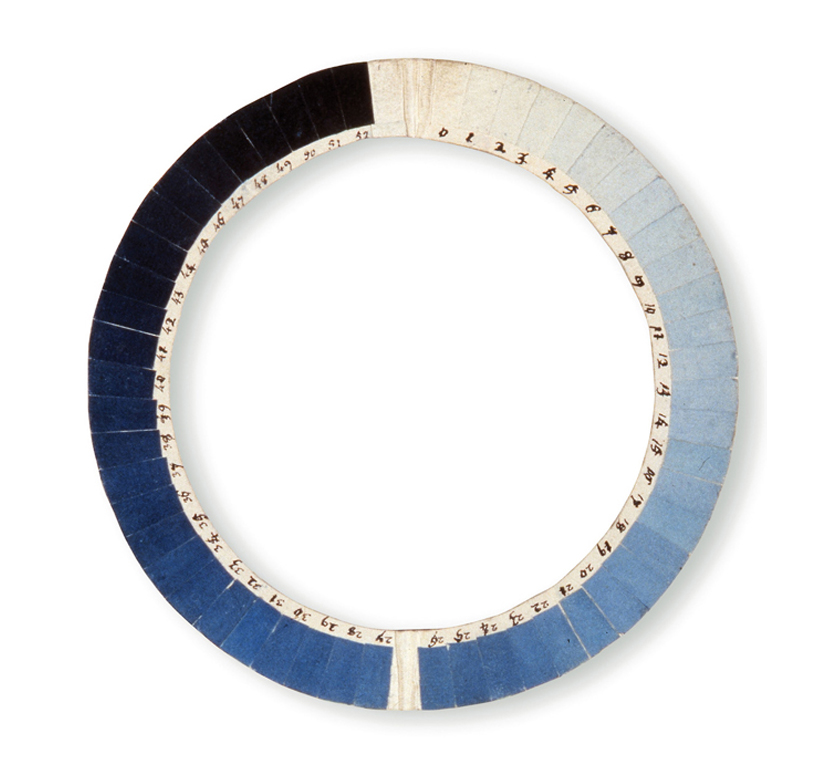
In 1789 he also invented the cyanometer, a simple circular tool with 53 shades of blue with which he systematically documented the blueness of the sky. He concluded that the blueness of the sky is influenced by both moisture and the amount of suspended particles in the air.
Monolith
Contemporary Monument
The Cyanometer is a new nonument from the Nonument series. Nonuments are a series of Martin Bricelj Baraga's futuristic, sci-fi and utopian installations and objects in public spaces.
The Cyanometer takes the form of a monolith. Its minimal shape is pierced with a circular color scale with which we can measure the blueness of the sky. Placed in cities, the Cyanometer shifts our attention to our connection with nature.
Air Quality (Visualisation)
Data Transparency
The Cyanometer displays the air pollution level on a color scale and points out the main pollutant in case of pollution. The pollution index is calculated from the concentration values of individual pollutants (PM10 particles, O3, NO2, SO2), which are refreshed every hour. The air pollution level is determined by the pollutant with the highest calculated index.
On the basis of this value, the state of air pollution is divided into four categories: low (green), moderate (yellow), high (orange), very high (red). If the air pollution level is high or very high in a particular time period, the Cyanometer displays the icon connected to the pollutant with the highest index. In the case of ozone, the icon indicates a connection to solar radiation, while in the case of other pollutants icons raise awareness of the emissions that cause the increased levels of the most problematic pollutant.
The proposed index of air quality is based on CAQI (Common Air Quality Index). Cyanometer's index consists of four levels, while CAQI determines five concentration levels. This results in a minor adaptation of concentration levels of each pollutant.
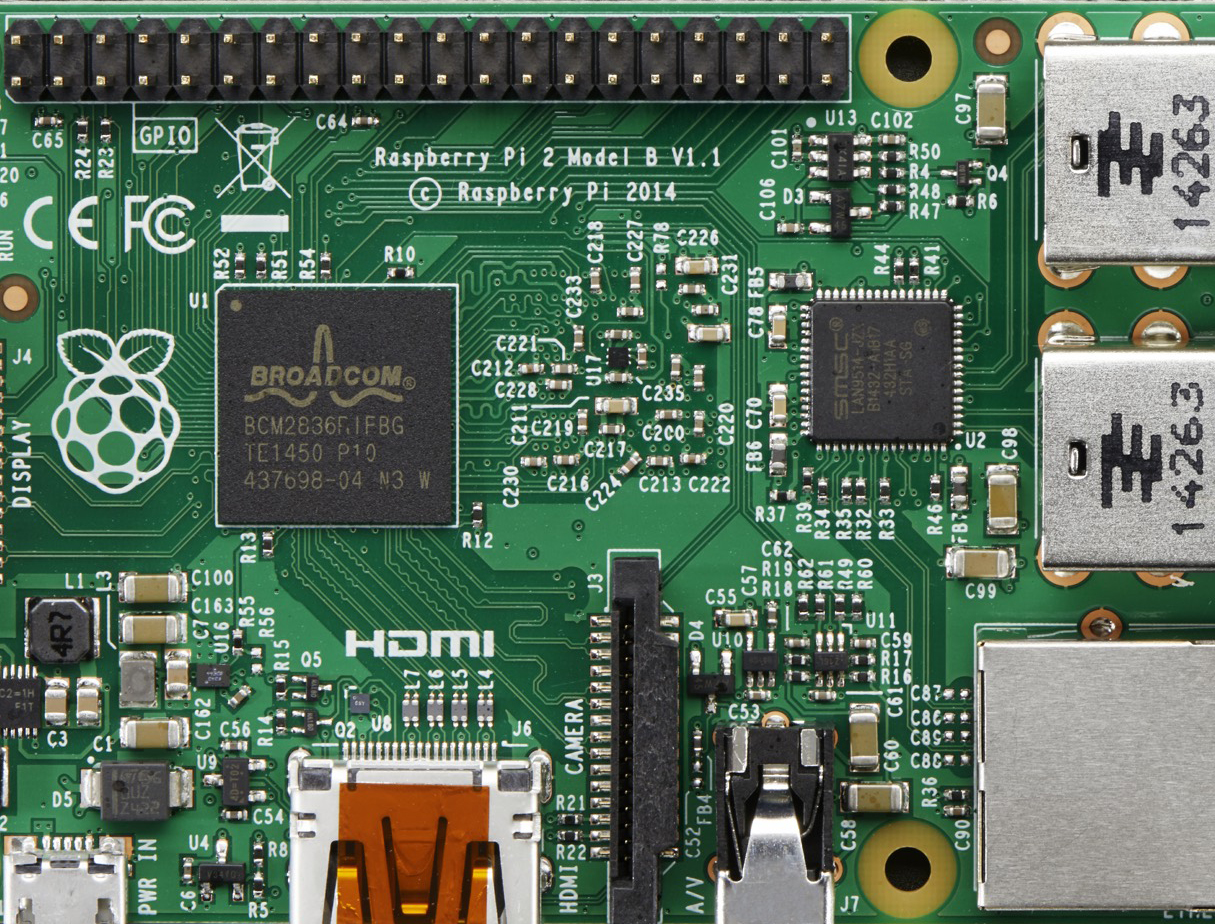
Cyanometer runs on the latest version of Raspberry Pi
Technology
Integrating Art and Science
Simple by design and aesthetic, the Cyanometer uses green energy and open source technology.
In Ljubljana, the Cyanometer is connected to the ARSO (Slovenian Environment Agency) air quality monitoring site located in Bežigrad. Its display shows:
1: a color scale ranging from red to green which visualises the level of quality of air 2: four pictograms underneath the color scale indicate the pollutant’s connection to solar radiation (in the case of ozone), or the main pollution source (in the case of other pollutants).
A sample of the sky is taken from a Raspberry-Pi camera and is translated into one of the 53 shades of blue. These variables are combined with current atmospheric data and visualized in a simple spectrum showing the quality of air.
Powered by solar panels, the Cyanometer is a self-sustaining organism that can be fully functional in any remote natural habitat, even in the most distant of areas such as the Alps.
Location
The first Cyanometer is located at Slovenska road, the main street of Ljubljana, which is the Green Capital of Europe 2016. It had been the busiest street in the city until recently, when it was transformed into a pedestrian zone with newly planted trees, envisioning a new city promenade. The Cyanometer is positioned at the beginning of the promenade with a view towards the Alps.
Blue Sky
What makes the sky blue?
White light arriving from our sun is a mixture of all colours of the spectrum. On a clear day, molecules of oxygen and nitrogen within our atmosphere scatter the individual colours due to their differences in wavelength and energy. Blue wavelengths are the most easily scattered and reach our eyes. At sunset, almost all of the blue colour has been bent below the horizon, leaving only red and orange.
Black carbons and aerosols increase the amount of particles in the atmosphere and further scatter the blue waves away from our eyes. This changes the colour and richness of the sky.
Subscribe
Stay updated on the launch of Cyanometer in Ljubljana